Update 26-10-2019: This week, I received a message from Jan Leptien of Tribe29. Jan informed me that the company behind Check_MK, Mathias Kettner GmbH has re-branded itself and became Tribe29 GmbH. The why of that decision can be found here.
The product name switched from Check_MK to Checkmk, so please read “Checkmk” where you may encounter “Check_MK”. They also moved their website from from mathias-kettner.com to checkmk.com.
A good starting point for Checkmk is the official user Guide which can be found at: https://checkmk.com/cms.html
Introduction
Infrastructure monitoring is essential to carry out proper System Administration. Infrastructure consists of many components, starting with the basics such as server hardware, network components, storage, uninterruptible power supplies, backup equipment, but also environmental factors such as temperature and air humidity in server rooms. Apart from understanding the hardware, software is the next layer. Starting with Operating Systems; monitoring of resources such as CPU, memory, storage, network, state of essential services etc. Next level is applications and chained applications. Examples, monitoring mail queues of a mail server or databases from a SQL Server and so on.
Today, many monitoring products are available; many of these are tailored to special purposes and don’t cover all aspects of an Infrastructure.
I have noticed in recent years that many organizations are searching for a single product that can be used for monitoring as many components. Because nowadays most organizations run workloads on virtualized infrastructure, this means an extra challenge for the monitoring software.
Years ago, when I worked as a Sysadmin and virtualization was in a very early stage, my favorite monitoring software was a combination of the following products Nagios, Cacti and an advanced Syslog server.
Nagios has its origins as an Open Source product. Due to its open source nature, there are many products derived from Nagios, examples; OP5, Opsview, Groundwork, Check_MK and many more.
Some time ago Check_MK caught my attention, mainly because of its versatility and its ability to monitor diverse infrastructure including VMware vSphere.
In this and subsequent blog posts, I will investigate the potential of Check_MK, in particular the possibilities to monitor vSphere and other VMware products. Since there are already many excellent articles written about the installation and configuration I will not repeat these steps. Where needed, I will include references to articles that I used to build my Proof-of-Concept and issues that I encountered.
Check_MK what is it?
Check_MK is built around Nagios, the Monitoring Core. It’s the engine that drives the monitoring application. The Check_MK team has developed several components to create a complete monitoring solution. For a complete overview see Figure 1; all not-grey colored boxes are components developed by the Check_MK team. The most noticeable components are:
- Check_MK Configuration & Check Engine; Common Services are automatically recognized, changing Service Checks is very easy and Check_MK comes with a hundreds of pre-defined checks.
- The Multisite Web Platform is the GUI component, a highly configurable interface where all data is presented.
- With Check_MK Web Administration Tool (WATO) you can perform most administrative tasks (configuration) from the web interface. It’s also rule-based.
- On the other hand, CLI tools are also available to perform actions straight from the command line
More information about the features of Check_MK.
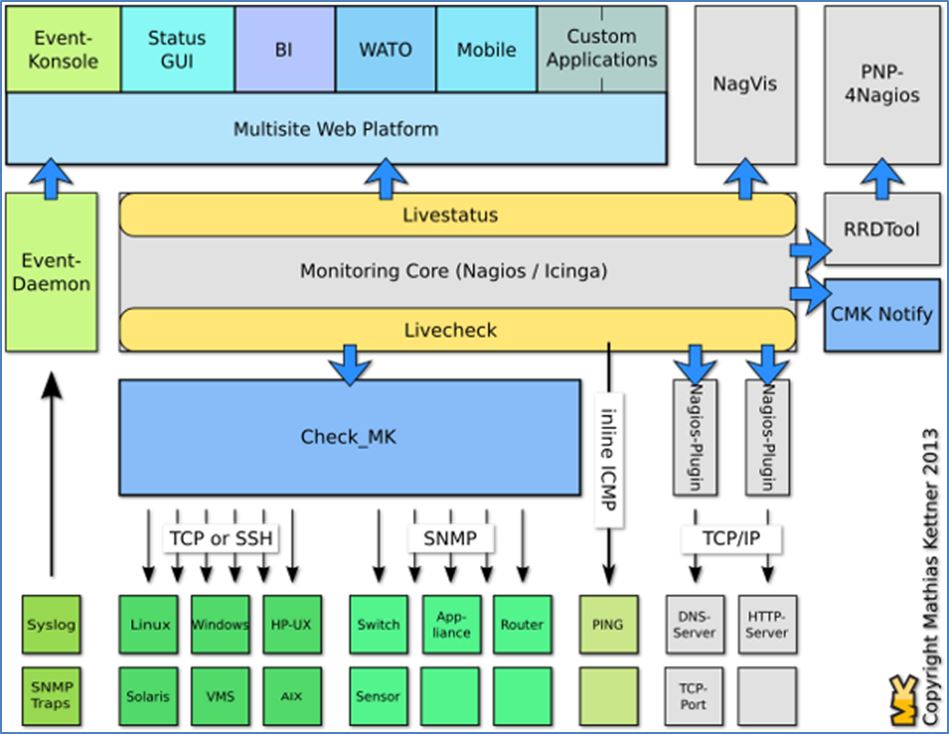 Figure 1- Picture Copyright Mathias Kettner
Check_MK comes in two editions; the Raw Edition (CRE) available under the terms of the GNU GPL v.2 and the Enterprise Edition (CEE). CEE comes with additional functions; most remarkable is the replacement of the Nagios core by the Check_MK Micro Core and additional performance improvements. The CEE entitles you for professional support and requires a subscription. For a comparison, see this link.
Installation and configuration
Check_MK is available for all major Linux distributions like Debian, Ubuntu, Suse, and Red hat / CentOS. As a RPM supporter, I decided to build my Check_MK POC on CentOS 7.
Very useful for setting up my POC was this document “System monitoring with Open Monitoring Distribution (OMD), hands-on tutorial” by Iñigo Aldazabal Mensa. Instead of VirtualBox, I installed the POC on my vSphere environment and I used a more recent version of CentOS.
For the correct EPEL (Extra Packages for Enterprise Linux) have a look at this page.
If you follow all steps in the tutorial until chapter 6 “Advanced Check_MK configuration”, you should end up with a Check_MK instance monitoring itself.
During my first steps configuring Check_MK, I have encountered this Error:
 Figure 2
After some research, it turned out that one of the services (mkeventd) was not running. After removing file status in the folder /omd/sites/<site name>/var/mkeventd and restarting the mkeventd service, everything was fine. Some useful commands:
To check the status of Check_MK run;
# omd status <site name>
Example, site name is "master"
# omd status master

To restart a service e.g. mkeventd;
# omd restart <site name> mkeventd

For an overview of available options, just type;
# omd
 Figure 3
Until now I didn’t mention that OMD, the Open Monitoring Distribution is also part. OMD is a distribution of several monitoring cores and add-ons that makes the installation and the upgrading of a monitoring system much easier. It’s also ideal for setting up a distributed monitoring system.
At this time we have installed a Linux server with Check_MK which performs some basic monitoring. In the second part, we will continue with the monitoring of VMware ESXi.

One thought on “Checkmk and vSphere – Introduction”